Preview in Dashboard
- Periodicity – switch between Annual · Quarterly · Monthly cohort tables.
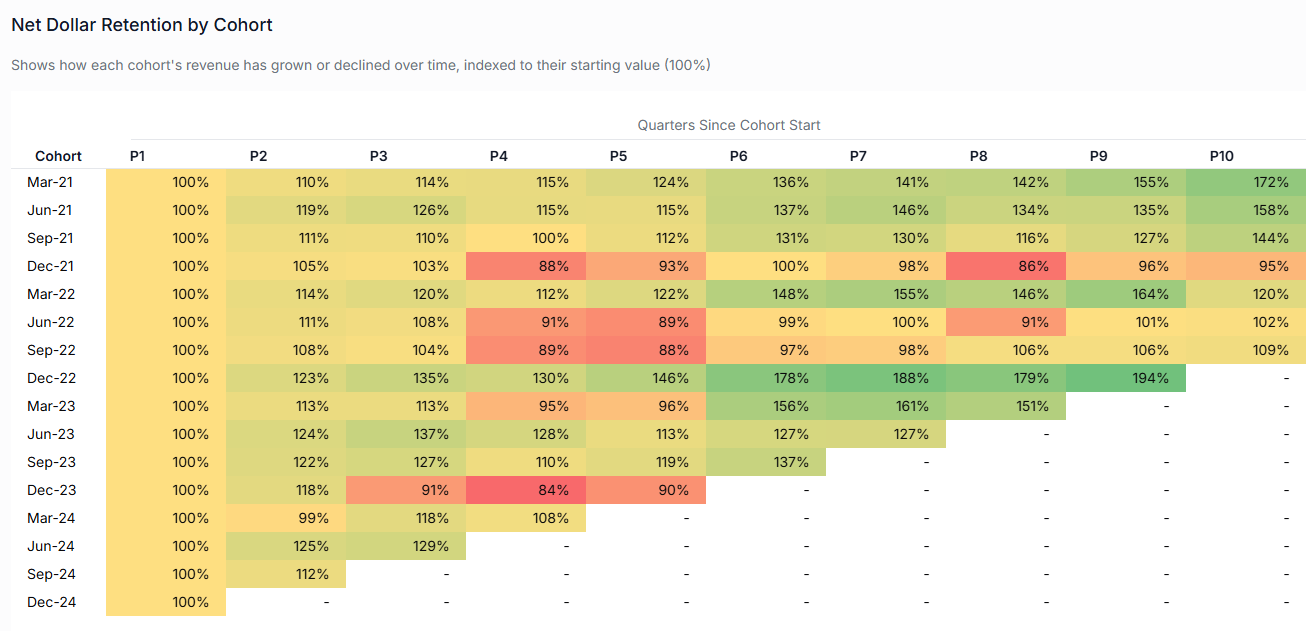
- View – See Indexed ARR heat-map, Net Dollar Retention %, or Customer Count.
Configure in Workbook Designer
Inside Workbook Designer › Excel Output Selection:- Expand Cohorts.
- Pick Annual · Quarterly · Monthly (add multiple if you like).
- Assign a Filter. Create saved filter combinations in the Filter Center.
- Hit Add to Workbook — Quikirr creates one formatted sheet per period.
Each period gets its own calculation tab so annual, quarterly, and monthly formulas remain clean and performant.
Excel Output Details
Each cohort sheet contains stacked blocks:| Block | What’s Inside (example columns) |
|---|---|
| ARR | Absolute ARR for each cohort as of each end-date |
| Indexed ARR | ARR indexed to cohort-launch = 100 (baseline highlighted yellow) |
| Indexed Net Dollar Retention | % growth vs baseline, heat-mapped in Emerald & Coral shades |
| Net Dollar Retention | Standard NDR % for each cohort/year |
| Customer Count | Logos active each period (+ Total row) |
| Gross Logo Retention | Pure logo retention %, no upsell/downsell effects |
Workflow Recap
1 · Explore in Dashboard
1 · Explore in Dashboard
Select period granularity, apply filters, and confirm retention trends look right.
2 · Add in Workbook Designer
2 · Add in Workbook Designer
Choose Annual/Quarterly/Monthly and any filter combos.
3 · Generate Excel
3 · Generate Excel
Get distinct cohort sheets for each period or filter you selected. Conditional-format heat-maps ship ready-to-present.