> ## Documentation Index
> Fetch the complete documentation index at: https://quikirr.com/llms.txt
> Use this file to discover all available pages before exploring further.
# Waterfalls
> Build ARR waterfalls in dashboard, pick the exact view, and export fully‑dynamic sheets.
## Preview in Dynamic Dashboard
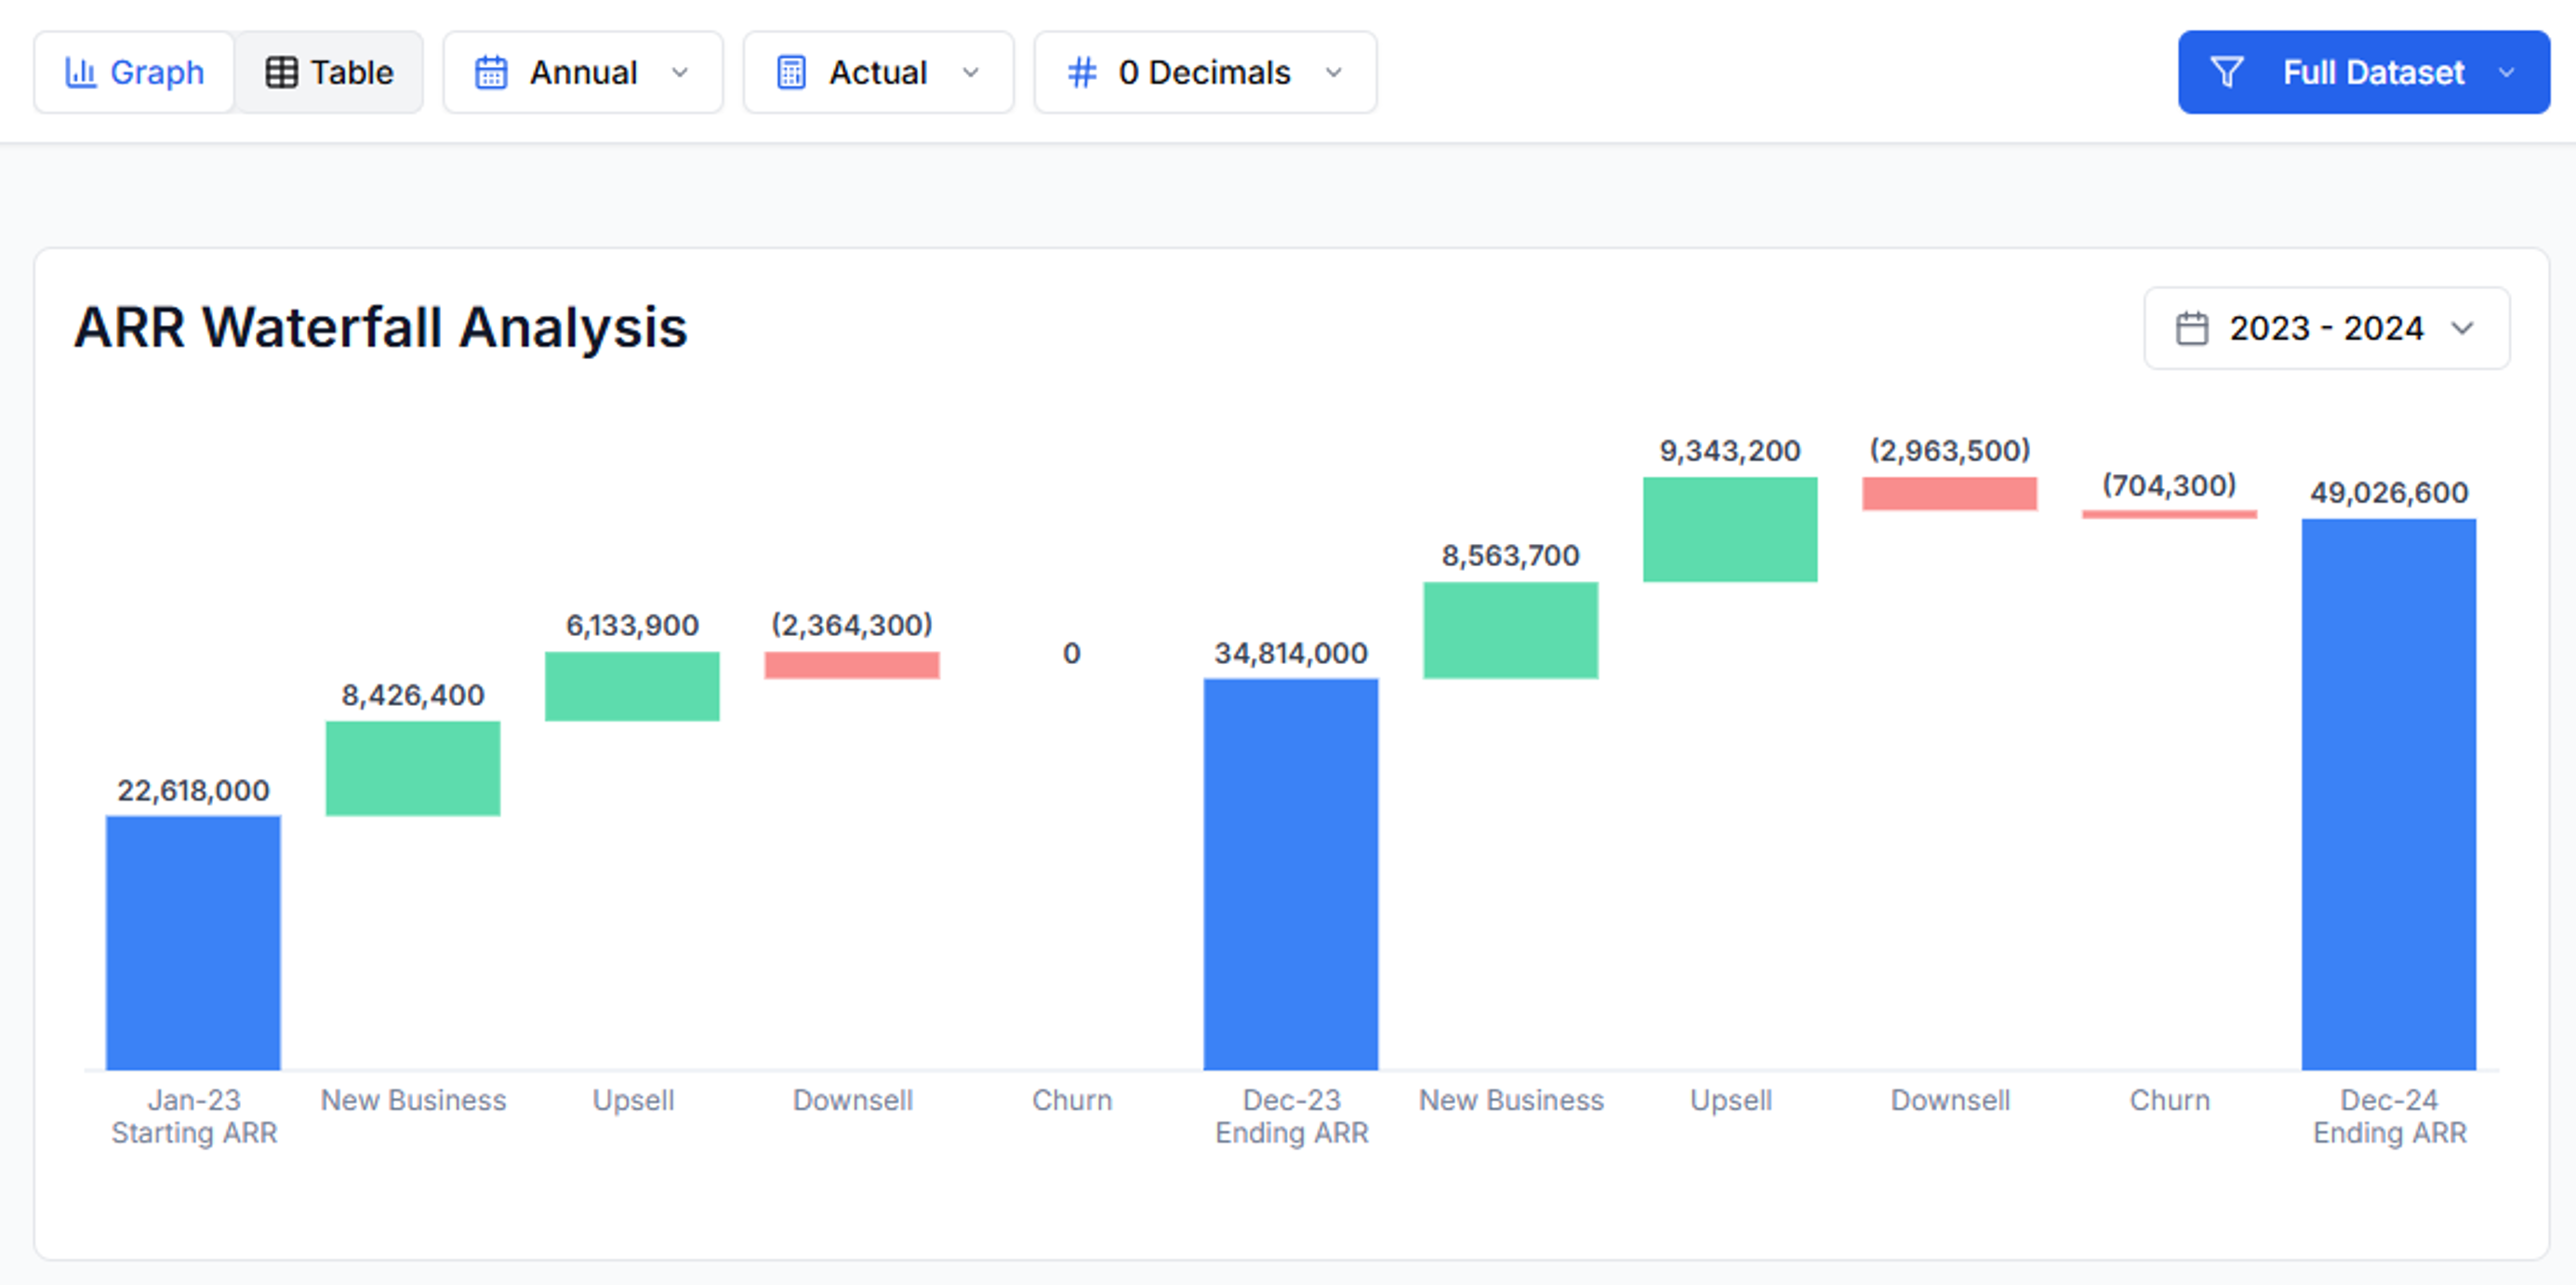 Head to **Analysis Views › ARR Waterfall** to explore growth drivers before you export:
* Toggle **Graph / Table**
* Select **Annual · Quarterly · Monthly** views
* Switch between the **full dataset** or apply filters based on any **descriptor columns** (e.g., region, product line) configured in the [Filter Center](/features/segmentation).
Your data renders instantly, letting you validate your analysis before generating the workbook.
***
## Choose Periods & Export
In **Workbook Designer** you decide which waterfall views ship with the model, from which time periods (Annual, LTM, Quarterly, Monthly) and whether to show **Stacked** or **Individual** waterfalls.
> Quikirr builds separate calculation tabs so each period compares the *last month* of the interval—e.g., Mar‑21 vs Jun‑21 for quarterly, Dec‑23 vs Dec‑24 for annual—ensuring true apples‑to‑apples ARR math.
***
## Excel Output Details
Head to **Analysis Views › ARR Waterfall** to explore growth drivers before you export:
* Toggle **Graph / Table**
* Select **Annual · Quarterly · Monthly** views
* Switch between the **full dataset** or apply filters based on any **descriptor columns** (e.g., region, product line) configured in the [Filter Center](/features/segmentation).
Your data renders instantly, letting you validate your analysis before generating the workbook.
***
## Choose Periods & Export
In **Workbook Designer** you decide which waterfall views ship with the model, from which time periods (Annual, LTM, Quarterly, Monthly) and whether to show **Stacked** or **Individual** waterfalls.
> Quikirr builds separate calculation tabs so each period compares the *last month* of the interval—e.g., Mar‑21 vs Jun‑21 for quarterly, Dec‑23 vs Dec‑24 for annual—ensuring true apples‑to‑apples ARR math.
***
## Excel Output Details
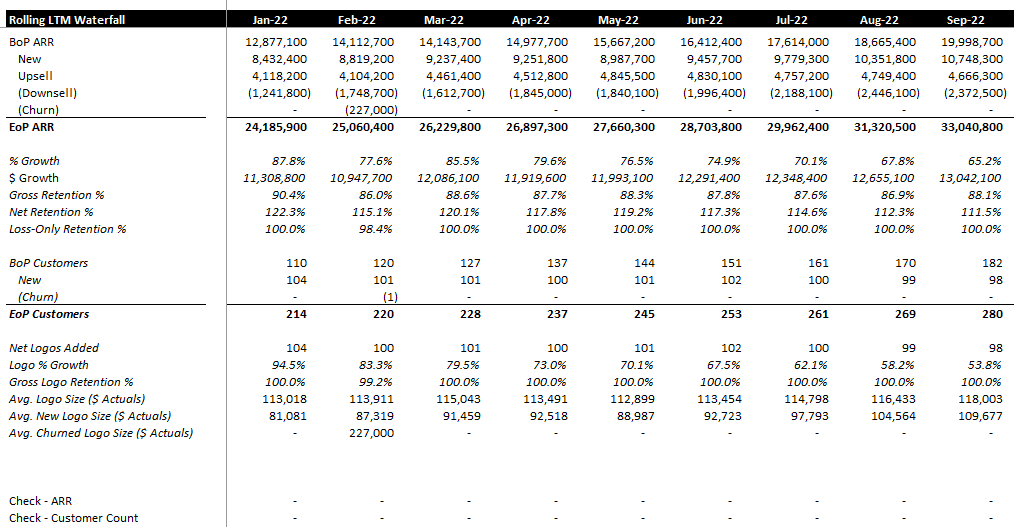 The generated Excel waterfall sheets are formula-driven and audit-ready. They include breakdowns for Beginning ARR, New, Upsell, Cross-Sell (if applicable), Downsell, Churn, and Ending ARR, along with key metrics like growth percentages and customer counts.
***
## Segment Waterfalls
Need to see ARR growth broken out across many products or regions? With Quikirr, you can easily generate Stacked Waterfalls for any segmentation attributes.
The generated Excel waterfall sheets are formula-driven and audit-ready. They include breakdowns for Beginning ARR, New, Upsell, Cross-Sell (if applicable), Downsell, Churn, and Ending ARR, along with key metrics like growth percentages and customer counts.
***
## Segment Waterfalls
Need to see ARR growth broken out across many products or regions? With Quikirr, you can easily generate Stacked Waterfalls for any segmentation attributes.
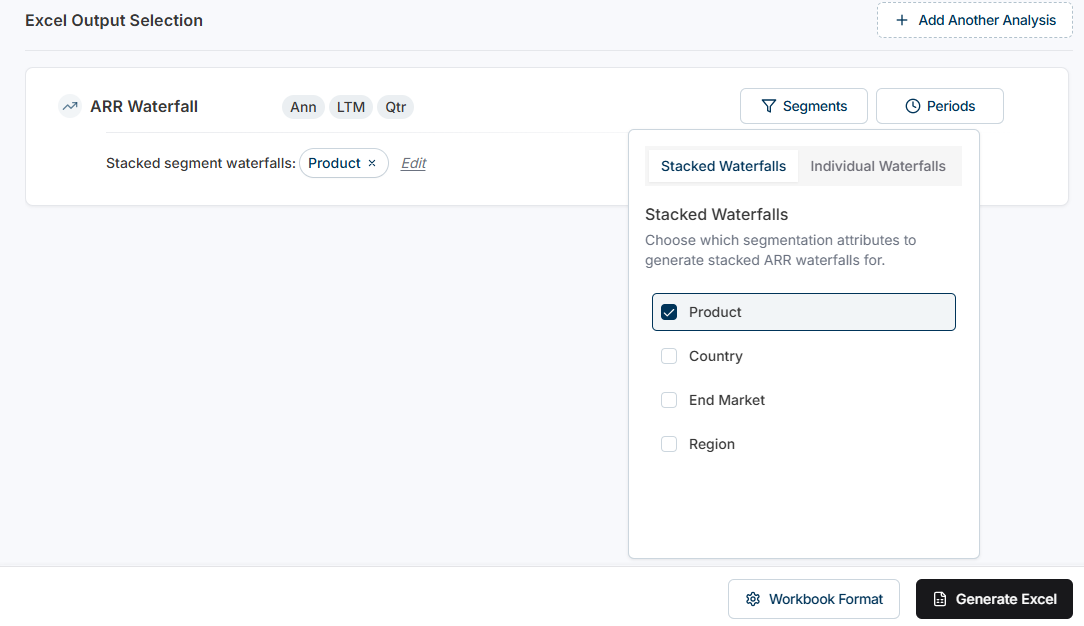 * **Stacked**: for each stacked waterfall selection, Quikirr generates two tabs: one with a waterfall for each segment stacked on top of each other, and a 'Summary' tab that spreads the key metrics across all segments.
* **Individual**: a separate, fully-formatted waterfall worksheet for each segment. See [Filtering](/features/segmentation) to learn how to set up your segments.
Segment summary for the selected stacked waterfall generated to Excel.
***
## Cross‑Sell Component
To include a cross-sell component in your product waterfalls:
1. In **Workbook Designer › Waterfall Analysis > Segments**, choose **Product** (i.e., the name of the column mapped as 'Product' during data ingestion) as the **Stacked Waterfall** dimension.
2. Ensure **Cross‑Sell Analysis** is enabled in Workbook Designer.
This will add a cross-sell component to your product waterfalls, highlighting incremental ARR from existing customers adopting additional products.
[See Cross-Sell Analysis for more details](/features/cross-sell)
***
### Workflow Recap
1. **Preview** the ARR Waterfall in the dashboard.
2. **Pick periods** (Annual, LTM, Quarterly, Monthly) and, if needed, **Stacked vs Individual** filtered waterfalls in the Workbook Designer.
3. Optionally, add a **Cross-Sell** component to product-level waterfalls.
4. **Generate Excel**—Quikirr adds fully‑formatted sheets in seconds.
* **Stacked**: for each stacked waterfall selection, Quikirr generates two tabs: one with a waterfall for each segment stacked on top of each other, and a 'Summary' tab that spreads the key metrics across all segments.
* **Individual**: a separate, fully-formatted waterfall worksheet for each segment. See [Filtering](/features/segmentation) to learn how to set up your segments.
Segment summary for the selected stacked waterfall generated to Excel.
***
## Cross‑Sell Component
To include a cross-sell component in your product waterfalls:
1. In **Workbook Designer › Waterfall Analysis > Segments**, choose **Product** (i.e., the name of the column mapped as 'Product' during data ingestion) as the **Stacked Waterfall** dimension.
2. Ensure **Cross‑Sell Analysis** is enabled in Workbook Designer.
This will add a cross-sell component to your product waterfalls, highlighting incremental ARR from existing customers adopting additional products.
[See Cross-Sell Analysis for more details](/features/cross-sell)
***
### Workflow Recap
1. **Preview** the ARR Waterfall in the dashboard.
2. **Pick periods** (Annual, LTM, Quarterly, Monthly) and, if needed, **Stacked vs Individual** filtered waterfalls in the Workbook Designer.
3. Optionally, add a **Cross-Sell** component to product-level waterfalls.
4. **Generate Excel**—Quikirr adds fully‑formatted sheets in seconds.