> ## Documentation Index
> Fetch the complete documentation index at: https://quikirr.com/llms.txt
> Use this file to discover all available pages before exploring further.
# Unit Economics
> Model LTV, CAC, payback, and the Magic Number—tweak gross-margin & S&M assumptions on the fly.
## Preview in Dashboard
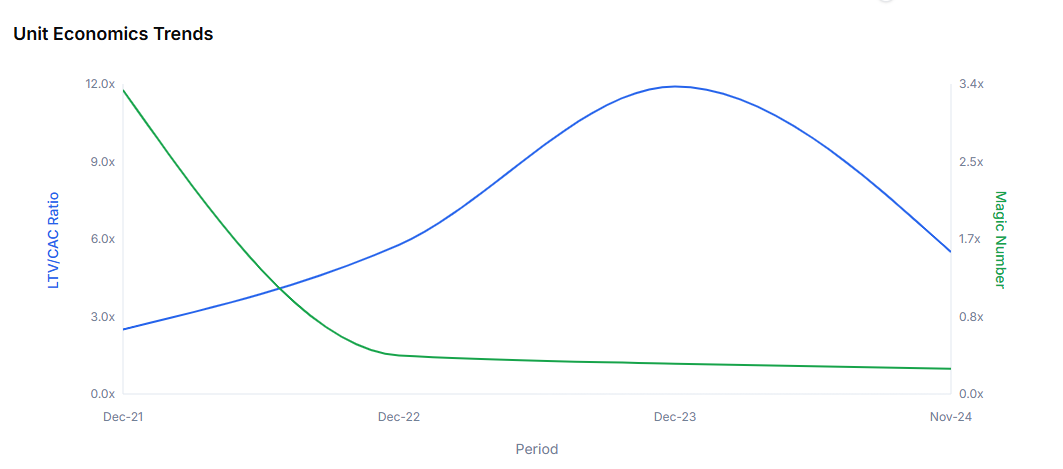 The **Unit Economics** view visualises how efficiency evolves, with two live controls:
| Slider | Range | Applies To |
| -------------------- | --------- | ------------------------------- |
| **Gross Margin %** | 0 – 100 % | Gross contribution & LTV math |
| **S\&M as % of ARR** | 0 – 100 % | CAC & Magic Number calculations |
Drag either slider and the line chart + table update instantly.
### Filter & Period Controls
* **Filter Combo** – isolate a segment using any saved filter (e.g. *Enterprise × North America*).
* **Periodicity** – generate **Annual · Quarterly · Monthly** (pick multiples if desired).
Filters use the same engine as Cohorts & Waterfalls—learn more in the [Filtering](/features/segmentation) guide (only for Excel outputs currently. Dashboard previews coming soon.)
***
## Add in Workbook Designer
1. Open **Workbook Designer › Excel Output Selection**.
2. Expand **Unit Economics**.
3. Choose period(s) (Annual, Quarterly, Monthly) and an optional **Filter Combo**.
4. Set default **Gross Margin %** and **S\&M %** (sliders auto-populate but you can hard-type).
5. Click **Add to Workbook** and proceed to generation.
> Each selected period creates its own sheet so annual, quarterly, and monthly calculations stay independent.
***
## Excel Output
**Key Features**
* **Yellow cells** for **Gross Margin %** & **S\&M % of ARR**—type hardcodes or link to another sheet.
* Trend chart (LTV/CAC ratio & Magic Number) updates as assumptions change.
* Metrics table per period, including:
| Category | Metrics Shown |
| --------------------- | ---------------------------------------------------- |
| **Scale** | Ending ARR, Ending Customer Count |
| **Yield** | Avg ARR per Customer |
| **Contribution** | Gross Contribution per Customer |
| **Retention Input** | Gross Dollar Retention % |
| **Lifetime & LTV** | Implied Lifetime (yrs), Lifetime Value |
| **CAC Block** | LTM S\&M Spend, New Logos, CAC, CAC Payback (months) |
| **Efficiency Ratios** | LTV / CAC, Magic Number |
***
## Workflow Recap
Adjust GM & S\&M sliders; apply segment filters; vet the efficiency story.
Pick periods, default assumptions, and any filter combo.
Edit yellow cells or link formulas to drive instant scenario analysis.
The **Unit Economics** view visualises how efficiency evolves, with two live controls:
| Slider | Range | Applies To |
| -------------------- | --------- | ------------------------------- |
| **Gross Margin %** | 0 – 100 % | Gross contribution & LTV math |
| **S\&M as % of ARR** | 0 – 100 % | CAC & Magic Number calculations |
Drag either slider and the line chart + table update instantly.
### Filter & Period Controls
* **Filter Combo** – isolate a segment using any saved filter (e.g. *Enterprise × North America*).
* **Periodicity** – generate **Annual · Quarterly · Monthly** (pick multiples if desired).
Filters use the same engine as Cohorts & Waterfalls—learn more in the [Filtering](/features/segmentation) guide (only for Excel outputs currently. Dashboard previews coming soon.)
***
## Add in Workbook Designer
1. Open **Workbook Designer › Excel Output Selection**.
2. Expand **Unit Economics**.
3. Choose period(s) (Annual, Quarterly, Monthly) and an optional **Filter Combo**.
4. Set default **Gross Margin %** and **S\&M %** (sliders auto-populate but you can hard-type).
5. Click **Add to Workbook** and proceed to generation.
> Each selected period creates its own sheet so annual, quarterly, and monthly calculations stay independent.
***
## Excel Output
**Key Features**
* **Yellow cells** for **Gross Margin %** & **S\&M % of ARR**—type hardcodes or link to another sheet.
* Trend chart (LTV/CAC ratio & Magic Number) updates as assumptions change.
* Metrics table per period, including:
| Category | Metrics Shown |
| --------------------- | ---------------------------------------------------- |
| **Scale** | Ending ARR, Ending Customer Count |
| **Yield** | Avg ARR per Customer |
| **Contribution** | Gross Contribution per Customer |
| **Retention Input** | Gross Dollar Retention % |
| **Lifetime & LTV** | Implied Lifetime (yrs), Lifetime Value |
| **CAC Block** | LTM S\&M Spend, New Logos, CAC, CAC Payback (months) |
| **Efficiency Ratios** | LTV / CAC, Magic Number |
***
## Workflow Recap
Adjust GM & S\&M sliders; apply segment filters; vet the efficiency story.
Pick periods, default assumptions, and any filter combo.
Edit yellow cells or link formulas to drive instant scenario analysis.