> ## Documentation Index
> Fetch the complete documentation index at: https://quikirr.com/llms.txt
> Use this file to discover all available pages before exploring further.
# Filtering
> Review subsets or segments of your data by creating and applying filters to your analyses.
***
## Fine‑Tune with the Filter Center
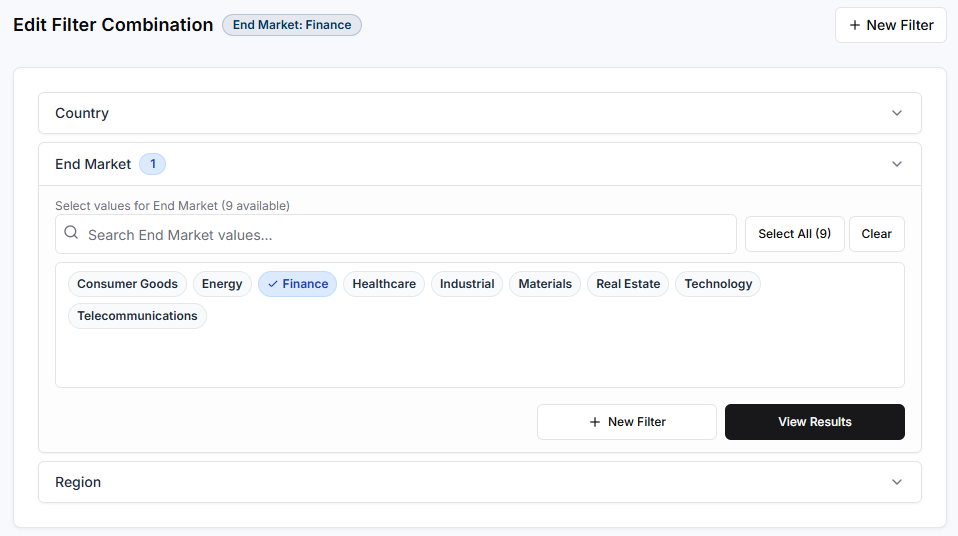 * Choose a single filter or combine multiple dimensions (e.g., Country, End Market, Region) using flexible AND / OR logic to define precise data slices. Filters correspond to the 'Descriptors' during ingest data tagging.
* Save filter combinations and instantly preview any saved filter set within the interactive analysis views.
* Assign saved filters to any analysis within the Workbook Designer, such as cohorts analysis, unit economics, or ARR waterfalls, to generate filtered Excel worksheets with dynamic toggles.
Dashboard view with filter applied.
***
## Excel Workbook: Dynamic Toggles
* Choose a single filter or combine multiple dimensions (e.g., Country, End Market, Region) using flexible AND / OR logic to define precise data slices. Filters correspond to the 'Descriptors' during ingest data tagging.
* Save filter combinations and instantly preview any saved filter set within the interactive analysis views.
* Assign saved filters to any analysis within the Workbook Designer, such as cohorts analysis, unit economics, or ARR waterfalls, to generate filtered Excel worksheets with dynamic toggles.
Dashboard view with filter applied.
***
## Excel Workbook: Dynamic Toggles
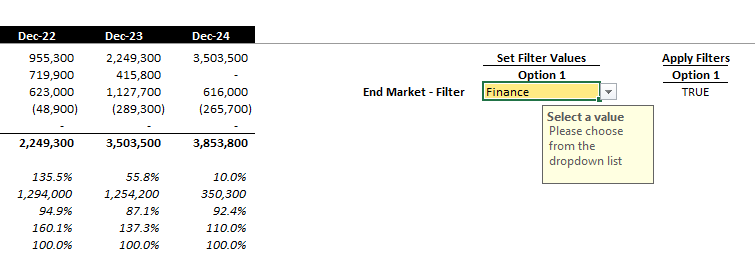 Each export includes a **Filters** worksheet that mirrors your saved combinations:
* **Set Filter Values**: yellow input cells list the dimension values in each option.
* **Apply Filters**: toggle cells (`TRUE` / `FALSE`) switch the current view across every sheet in the model.
* Changes cascade instantly thanks to dynamic formulas.
***
See also [Segment Waterfalls](/features/waterfalls#segment-waterfalls).
## Workflow Recap
1. **Define filter combos** in the Filter Center.
Each export includes a **Filters** worksheet that mirrors your saved combinations:
* **Set Filter Values**: yellow input cells list the dimension values in each option.
* **Apply Filters**: toggle cells (`TRUE` / `FALSE`) switch the current view across every sheet in the model.
* Changes cascade instantly thanks to dynamic formulas.
***
See also [Segment Waterfalls](/features/waterfalls#segment-waterfalls).
## Workflow Recap
1. **Define filter combos** in the Filter Center.
2. **Preview the filters** in the dashboard top bar, from the Waterfalls view for instance.
3. Assign the filter to an analysis via the Workbook Designer page to generate the relevant tabs in the Excel workbook.
4. Dynamically toggle filters directly in Excel with live data refresh.