> ## Documentation Index
> Fetch the complete documentation index at: https://quikirr.com/llms.txt
> Use this file to discover all available pages before exploring further.
# Cohort Analysis
> Track retention, ARR-per-customer, and logo dynamics across cohorts—filter, preview, and export in a few clicks.
## Preview in Dashboard
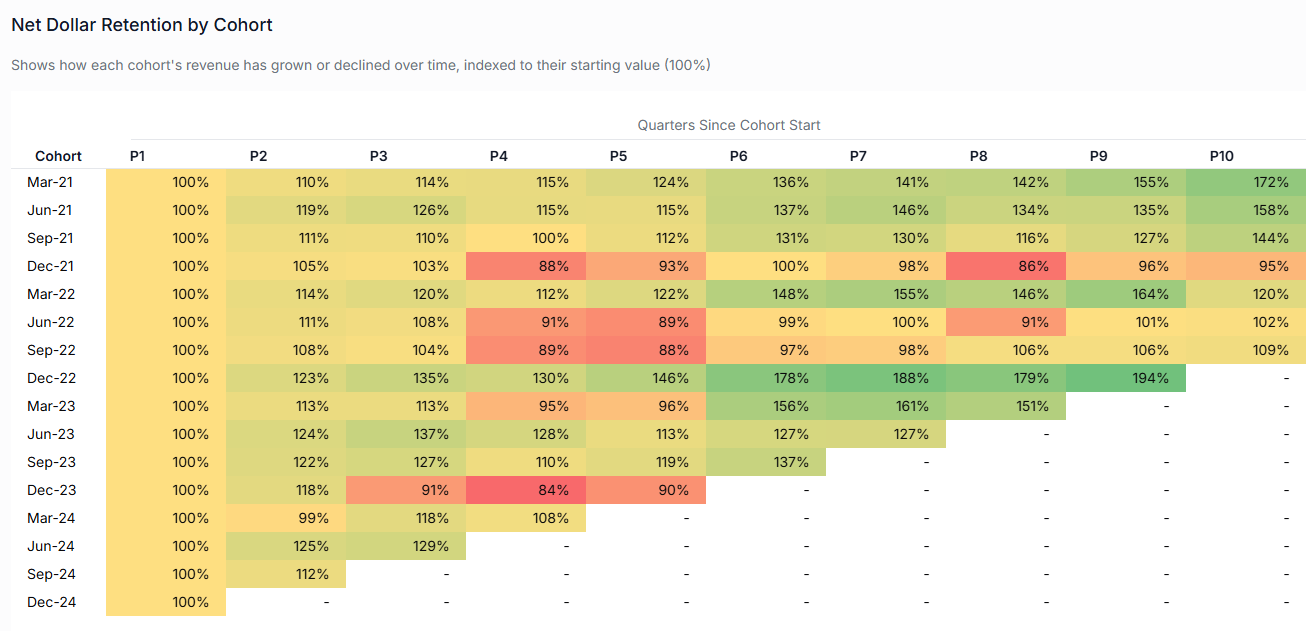 Open **Analysis Views › Cohort Analysis** to explore retention before exporting:
* **Periodicity** – switch between **Annual · Quarterly · Monthly** cohort tables.
* **View** – See Indexed ARR heat-map, Net Dollar Retention %, or Customer Count.
***
## Configure in Workbook Designer
Inside **Workbook Designer › Excel Output Selection**:
1. Expand **Cohorts**.
2. Pick **Annual · Quarterly · Monthly** (add multiple if you like).
3. Assign a **Filter**. Create [saved filter combinations](/features/segmentation) in the Filter Center.
4. Hit **Add to Workbook** — Quikirr creates one formatted sheet per period.
> Each period gets its own calculation tab so annual, quarterly, and monthly formulas remain clean and performant.
***
## Excel Output Details
Each cohort sheet contains stacked blocks:
| Block | What's Inside (example columns) |
| -------------------------------- | ---------------------------------------------------------------- |
| **ARR** | Absolute ARR for each cohort as of each end-date |
| **Indexed ARR** | ARR indexed to cohort-launch = 100 (baseline highlighted yellow) |
| **Indexed Net Dollar Retention** | % growth vs baseline, heat-mapped in Emerald & Coral shades |
| **Net Dollar Retention** | Standard NDR % for each cohort/year |
| **Customer Count** | Logos active each period (+ Total row) |
| **Gross Logo Retention** | Pure logo retention %, no upsell/downsell effects |
***
## Workflow Recap
Select period granularity, apply filters, and confirm retention trends look right.
Choose Annual/Quarterly/Monthly and any filter combos.
Get distinct cohort sheets for each period or filter you selected. Conditional-format heat-maps ship ready-to-present.
Open **Analysis Views › Cohort Analysis** to explore retention before exporting:
* **Periodicity** – switch between **Annual · Quarterly · Monthly** cohort tables.
* **View** – See Indexed ARR heat-map, Net Dollar Retention %, or Customer Count.
***
## Configure in Workbook Designer
Inside **Workbook Designer › Excel Output Selection**:
1. Expand **Cohorts**.
2. Pick **Annual · Quarterly · Monthly** (add multiple if you like).
3. Assign a **Filter**. Create [saved filter combinations](/features/segmentation) in the Filter Center.
4. Hit **Add to Workbook** — Quikirr creates one formatted sheet per period.
> Each period gets its own calculation tab so annual, quarterly, and monthly formulas remain clean and performant.
***
## Excel Output Details
Each cohort sheet contains stacked blocks:
| Block | What's Inside (example columns) |
| -------------------------------- | ---------------------------------------------------------------- |
| **ARR** | Absolute ARR for each cohort as of each end-date |
| **Indexed ARR** | ARR indexed to cohort-launch = 100 (baseline highlighted yellow) |
| **Indexed Net Dollar Retention** | % growth vs baseline, heat-mapped in Emerald & Coral shades |
| **Net Dollar Retention** | Standard NDR % for each cohort/year |
| **Customer Count** | Logos active each period (+ Total row) |
| **Gross Logo Retention** | Pure logo retention %, no upsell/downsell effects |
***
## Workflow Recap
Select period granularity, apply filters, and confirm retention trends look right.
Choose Annual/Quarterly/Monthly and any filter combos.
Get distinct cohort sheets for each period or filter you selected. Conditional-format heat-maps ship ready-to-present.